Monday, March 14, 2011

Final Project: Drug Cartels in Mexico


Introduction

The topic of my research is drug cartels in the country of Mexico and their impacts within the country itself as well as in the United States. Trafficking by drug cartels has been happening for a long time; however drug cartel control of states and consequently death numbers have increased dramatically in the last five years. I focused mostly on the presence of cartels in Mexico because this is the point of origin for the trafficking of drugs (drugs also come to the United States from other countries, but I am choosing to study their transfer from just Mexico). Drugs are produced and trafficked to supply the demands of people who use drugs in the United States. The presence of drug cartels has negatively impacted Mexico and left many casualties; those dead include people actively participating in drug trafficking, government and enforcement officials not cooperating, and innocent standbys. Cartels have spread throughout the country diminishing the authority of government and enforcement officials. Likely scenarios in the lives of Mexican people dealing with the presence of drug cartels are as follows: one day drug cartels fighting for the control of territory start shooting in the middle of a park (30 dead); drug cartels demand monetary cooperation from business owners in a town and if they deny it, family members will end up missing or dead; people seeking help from authorities will receive indifference as a response because authorities themselves are threatened by the cartels or cooperating with them. The maps displayed illustrate distribution of presence of drug cartels in Mexico, distribution of highest death tolls, and presence of drug trafficking organizations in the United States.

Methods

The production and transportation of drugs starts in Mexico and takes several different paths throughout the country until these reach the main portal to enter the United States. Following the path drugs take requires knowing who is in control throughout the country. I gave Mexico’s states a new classification which shows which cartels control which states. However, this is not as simple as it sounds; for the most part, clear distinctions or boundaries for which state territories belong to which cartels are non-existent. Drug cartels are constantly changing their control regions and their allies/enemies with other cartels to their convenience. The presence of these cartels disrupts normal government and enforcement policies and regulations as these officials are threatened by cartels for “cooperation”. Therefore, the drug cartel organizations are becoming a new form of government, and with time, they increase their authority in the states of Mexico. With an unstable government and drug cartel control in Mexico, the consequence is a dramatic rise in casualties. Therefore it is important to study how deaths are distributed in an effort to understand why they are distributed so (I mapped top death tolls by municipality, by state, and showed distribution of deaths across the country). Finally, it is important to study where the drugs are being sent to and how they are getting there. The most common way for drugs to enter the United States from Mexico is by crossing the border; after entering the country, drugs are distributed by drug trafficking organizations in different states (this is also illustrated in one of the maps below).


Results

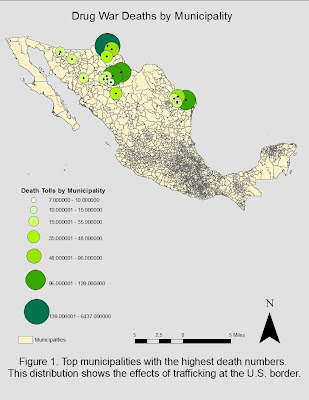
Figure one displays the distribution of deaths by municipality across the northern states of Mexico (Sonora, Chihuahua, Coahuila, Nuevo Leon, and Tamaulipas). These municipalities are the ones in which some of the highest death tolls were taken. Their concentration in the northern region of the country is most likely due to the proximity of these states to the international border. Drug cartel activity should be higher in this region because there is a component of international relations. It is not as easy to traffic drugs across an international border as it is to traffic them within the same country.
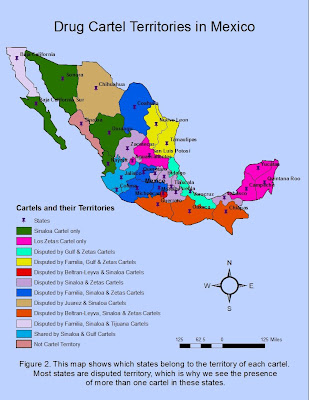
Figure two shows which states are controlled by each cartel. As I mentioned before, there is not a clear distinction of who controls what. As seen in the map, most of the states in Mexico are disputed by the different drug cartels. This means that more than one cartel is present in most states; this kind of cartel distribution results in many violent wars (cartel versus cartel). The different drug cartels are the following: Tijuana, Sinaloa, Los Zetas, Juarez, La Familia, Beltran-Leyva, and Gulf cartels. As shown in the map, some states have been shared by cartels; alliances between them have formed in the past but they are not exactly loyal or constant. The presence of drug cartels in most of the states of Mexico show the growing power of the cartels, this situation only worsens the drug trafficking situation and endangers more lives.
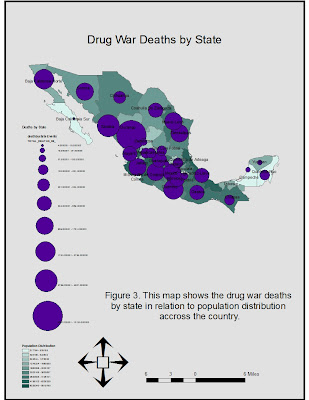
Figure three illustrates death numbers across the entire country by state as well as population distribution. This map is able to show the effect of drug cartels in terms of internal trafficking of drugs, cartel to cartel relations, and the cartels’ form of oppressing citizens (the use of threats and violence). The map shows variability in death numbers, however, it clearly shows deaths happening throughout the entire country. As we can see, it does not necessarily show a correlation between high population and high death numbers.
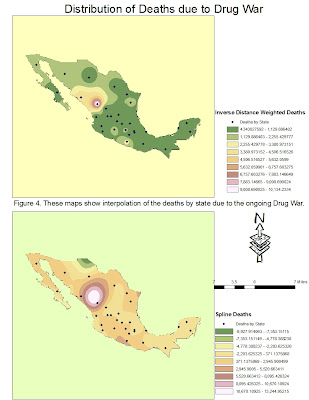
Figure four helps us to understand how death events are distributed in the country through the method of interpolation. The top map of this figure is showing deaths distribution by inverse distance weighted interpolation. This allows analysis of death events in areas where data is not available. This map shows higher death tolls in the northwestern part of the country and lower death tolls towards the center and south regions of the country. The lower map also shows a construction of new data points (distribution of deaths where there is no exact data) from points that were already known (known death events); this one shows the spline interpolation of death events.
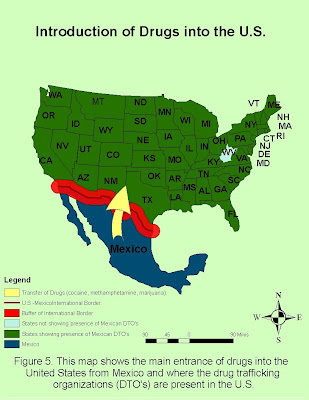
Figure five is useful in emphasizing the international aspect of the drug trafficking problem. It shows the states in the United States which have been known to experience the presence of Mexican drug trafficking organizations. We also see an emphasis in the main route of entrance of drugs to the United States which is the Mexican-U.S. international border. This map illustrates just how much of an impact drug trafficking has on the states, as we see every state except for one with some kind of drug trafficking activity. We can also understand from this map that different types of drugs are transported, among which are cocaine, methamphetamine, and marijuana.


Conclusion

Drug trafficking cartels are turning Mexico into a completely different country. Mexico is experiencing a growing force of the cartels which leads to internal cartel wars, a weak government, and most importantly very high death tolls. Production and trafficking of drugs is still taking place because there are consumers in the United States receiving the drugs. From the analysis, it can also be said that the Mexico-U.S. international border is not as strong as was thought but is instead permeable and allowing drug trafficking to continue. Therefore, I turn to ask, will the United States government do anything to enforce laws and regulations which will prevent the smuggling of drugs into the country? It is difficult to believe that these drug cartels are so organized that they can defeat U.S. efforts to stop drug trafficking which would help alleviate the ongoing drug war. However, we see from the maps displayed that drug trafficking organizations have been present in all but one of the states in the U.S. So meanwhile some kind of plan is made to stop the entrance of drugs into the United States, Mexico will continue to suffer the Drug War; drug cartels will continue to fight for control of Mexican states, killing many in the process, and all of this only to export drugs to the U.S.

References

http://www.ncjrs.gov/pdffiles1/nij/218561.pdf
http://www.justice.gov/dea/major/meta.htm
http://gis.ats.ucla.edu//Mapshare/Default.cfm
http://geo-mexico.com/?s=drug+war&searchsubmit=
http://en.wikipedia.org/wiki/Mexican_Drug_War#Mexican_cartels
http://www.policyalmanac.org/crime/archive/drug_trafficking.shtml
Tuesday, March 1, 2011

Interpolation of Rainfall for L.A. County


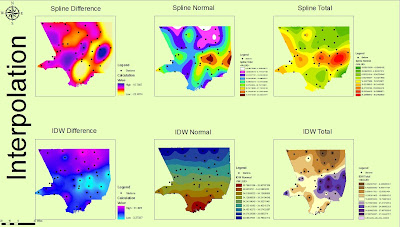
This lab made possible to analyze rainfall for L.A. county with different interpolation techniques. These techniques were useful in generating surface grids from point data. In order to use the point data, I had to make it ArcMap readable by formatting it on excel. I observed that values of total and normal precipitation seem to be variable in terms of which value is higher within each station. Once the data was ready, I had to choose which interpolation technique was appropriate.

At first, it seemed like I just had to chose whichever technique came to mind but as I tried the different techniques (IWD, spline, and kriging), I realized that specific techniques are useful in displaying the L.A. county rainfall data. The one which I found was not useful was kriging, it provided a surface grid which was ineffective in displaying the data. Therefore I used only the spline and IWD techniques. The inverse distance weighted method is useful in creating surface maps for a dense set of points and captures the extent of local surface variation for analysis. The spline method minimizes overall surface curvature; it creates a smooth surface which passes through all the data points.

The different surface grids which result from each interpolation technique can be used for different types of analysis. Therefore, it is important to know what the maps will be used for. Because IWD provides a more point by point specific surface grid, it would be more useful for accurate analysis of stations; for example knowing exactly how many stations there are and where. On the other hand, the spline technique which provides somewhat of a more relative analysis of the stations, can be used to analyze where more stations are needed or where stations need to be shut down. After discussing what each technique might be more useful for, I think the IWD is most useful for the L.A. county rainfall data. I believe so because it allows analysis of each station specifically, because it is appropriate for a dense set of points, and because variation in the surface is displayed.

Tuesday, February 22, 2011

Fire Hazard Evaluation


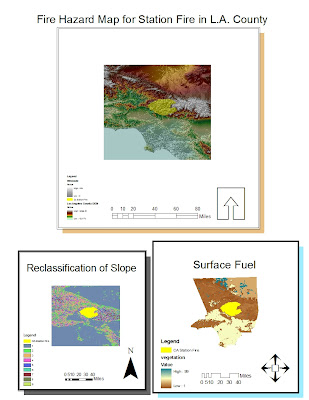
The map displayed above shows the fire perimeter of the station fire which happened in Los Angeles County in 2009. It is important to take into consideration all aspects which are related to the fire; these are slope, fire perimeter, and fire fuel. The slope of the terrain which the fire took place in is important because it gives information such as the direction the fire will burn and how fast it will burn (depending on the steepness of the slope). The fire perimeter provides information on the bounds and extent of the fire. The fire fuel, which is vegetation, can help determine where fire is more likely to burn and also what types of ecosystems will be affected by the fire.

This paragraph concerns more of the practical steps taken to produce the maps displayed. The seamless server from the USGS website was an easy way to obtain the digital elevation model for the county of Los Angeles. Once this was set, the FRAP website (http://frap.cdf.ca.gov/) was useful in providing surface fuels map as well as the fire perimeter data. This was the data needed to evaluate the fire hazard. It was easy to follow steps to accommodate the data to display the Station fire along with the DEM and hillshade. However, I encountered a problem with the reclassification of the surface fuel; this is why I only showed the original information for this individual map.

The problem I encountered had to do with the grid form of the surface fuel data and it made reclassification of this not possible. In order to fix this problem, I tried to download the data and start the process for this data set from scratch (I thought maybe the file was corrupted), but I still could not fix this issue. However, the surface fuel map shown, still provides a great deal of information in terms of fuel for the station fire. This is a map which informs about the bounds of the station fire, the slope of where it took place, and the surface fuel for the fire. Also, the scale bars, legends, and north arrows provide orientation to readers of the map.

Tuesday, February 15, 2011

Landfill Suitability Analysis Factors-Lab # 5


Analyzing landfill suitability in terms of streams, elevation, cover class, soil drainage, and distance to landfills is very important and useful. These analysis provide information about specific identities in a place (such as Gallatin County in this project), so as to attain a prioritized suitability for landfills; for example, if the priority is determining where to put landfills based on cover class, the map of this category is used. These types of decisions are centered around the effects on humans, as seen in the Sahagun article, therefore it is important to note how each category analyzed affects humans as well.

Continuing with the cover class category, it is also possible within the category to make distinctions between places which could potentially sustain landfills and those which can not. When reclassifying the cover class category, I listed the cover classes of water and cropland as completely unsuitable (entering NoData in their fields); because landfills possibly represent danger in terms of toxicity and birth defects, they should by no means be found in these cover classes. Areas of water and cropland are of the most important resources needed by humans, therefore these should be most taken care of so as to avoid their contamination (which would lead to negative impacts on humans).

Knowing what kinds of toxic elements may be present in landfills as well as at what proximity they represent a danger to humans is also very important. In this case, we can put emphasis on the category of distance to landfills. By using this analysis, we can interpret the distance to landfills in terms of lethality for humans; how close to a toxic element is too close? At what proximity can PCB's (a cancer causing element mentioned by Sahagun) affect humans? We can also think about runoff of toxins from landfills to streams as a problem. If landfills are too close to streams, their contents may be carried off to the water; we see that the stream buffers category helps us analyze what the right distance of landfills from streams can be.

In similar forms, the soil drainage and slope of elevation categories help display how toxins can be carried off to places where they would have a negative impact on humans. The final analysis category, allows an investigation of all categories displayed in one map. It is important to analyze all of the categories together in order to account for overlaps; perhaps, places which are definitely not suitable can be more easily differentiated. This kind of analysis may also lead to the discovery of places in which it is reasonable to place landfills.

Therefore we see the importance of making educated and cautious decisions about the placement as well as the expansion of landfills. In Sahagun's article, expansion of a landfill in the Central valley is detained until further tests determine whether or not this creates a negative impact on humans. Because water is so necessary for human survival, efforts to clean already contaminated water are also being considered by environmental agencies.

Wednesday, February 2, 2011

Quiz # 1- L.A. City Schools and Medical Marijuana Dispensaries


I am in favor of the decision made by the L.A. City Council which requires medical marijuana dispensaries to be at least one thousand feet from places where children congregate. I think it is most important to evaluate this decision in terms of Los Angeles city schools; schools is where children spend majority of their time. Not only is it important that children spend much of their time at their respective school, also this is where their learning foundation is based. Therefore, I made my decision based on the perspective that schools are the pillar of growth for children and this should in no way be disturbed. However, I would like to point out that there can be other perspectives from which to view this issue which can result in a different verdict from mine.

It is important to provide voters with information such as is provided in my map, so that informed voting can take place. Therefore, it is also important to provide accurate data. I would like to point out that the main concentration is on the selected Los Angeles city. My map shows buffers of 1,000 feet around each and every school in the city of Los Angeles. I also geocoded the addresses for the medical marijuana dispensaries within Los Angeles. The purpose of this data display is to see where these dispensaries cross into the buffer zone (which means they would be violating the decision made by the Los Angeles City Council). At least half of the dispensaries cross into the buffer zones for different schools. This should not be the case if children and their environment is to be protected and respected.


Implementing this decision does imply the shutting down of those dispensaries which cross into the buffer zones; this results in costs of closure and, probably also affects the owners of the dispensaries. Even though there may be difficulties, it is important to measure the value of each side of the conflict. Is it more valuable to shelter children from the activities of dispensaries so as to not disrupt their developmental stage? Or is it more important to avoid the costs I previously mentioned and let the dispensaries keep earning their profit? I believe the priority lies within how the children are affected at all times; which is why I reiterate that I am in favor of the Los Angeles City Council decision.

Tuesday, February 1, 2011

Digitizing Iraq-1999


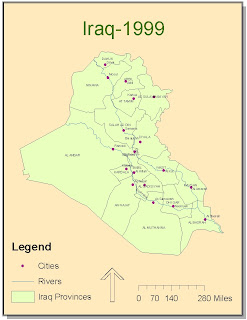
I had some trouble with being able to clearly separate the province and city names. ArcMap continued to give me an error message about the map units. Overseeing this minor detail however, the digitizing was relatively easy and straight forward. I liked having to figure out some of the operations by just experimenting and some by getting help from classmates. I had trouble with the function of cutting the polygon which was necessary to make the provinces; I had overlooked the fact that my overall tracing of the Iraq map had to be selected in order to do proper snapping. I believe this lab was very instructive and that it is also very useful in common practice.

Tuesday, January 25, 2011

Lab 3-Geocoding Elementary Schools


I chose to geocode the locations of elementary schools in two different counties in the state of California. These are the Fresno and Merced counties in the central valley. This map can be a useful resource for families who have children going to an elementary school in these counties. These elementary schools are of two types, although no distinction is made in the map itself; some fall into the category of kindergarten through sixth grade and the others into the category of kindergarten through fifth grade.

Parents can use my map as a resource to decide which elementary school their children will attend. My map provides location information on these elementary schools. This is useful information for determining the distance between schools and homes. Then, parents can compare how far children will travel to and from school, and what method of transportation they will need. Parents can ask and answer questions such as: can I drop my child off at school? Does my child need public or school transportation? Can my child walk to school? Furthermore, the information in my map can be useful to families already living in the counties of Fresno and Merced, as well as to families arriving to these counties.

In the process of geocoding, there are multiple steps which I followed to arrive at the final map. Before displaying any data through ArcMap and using an address locator, it was important to have the right amount and format of data. At first, I struggled with this first part of the process. As I looked through different possible locations to geocode, I realized that I needed addresses, cities, states, and zip codes for each location. Having this information allowed an accurate assessment of the address locator in matching addresses. I entered the data for each elementary school into an excel spreadsheet; this process was tedious, but getting it right prevented mistakes in the following steps on ArcMap. I also needed a shapefile of the streets of California to display the locations appropriately.

Once on ArcMap, I added the elementary school data on the excel spreadsheet. I also added the streets shapefile. Finally, I used an address locator to match the elementary school locations and display them on the streets. I added the address locator through ArcCatalog. The locations of the elementary schools are concentrated mainly in two areas, which correspond to the counties of Fresno and Merced. I geocoded the elementary schools in these two counties to provide information mainly to parents, but this information can also be used by school districts in matters of construction of new schools, or transportation systems for students.