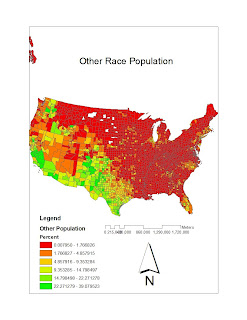


My first map, is titled “Other Race Population” because it shows county level race data for some other race alone, against the continental United States, and ranked by percent. I retrieved the necessary data from the U.S. Census website www.census.gov. The color scheme which I chose for this map is explained by the legend at the lower left corner of the map; it contains six classes. The color scheme highlights the population percent distribution and makes for very distinct areas on the map; this creates a map which is easily read and searched for specific information about population. In the northeastern direction, the population percentages for this race are low; these increase in the southwestern part of the country. The scale bar and north arrow provide information for measurements and orientation respectively.
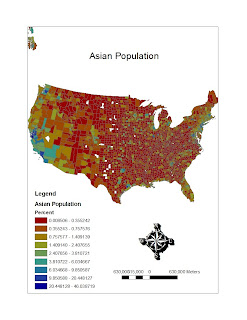
My second map is titled “Asian Population”, it shows county level race data, ranked by percent for the Asian population against the continental United States. This data I also retrieved from www.census.gov and it is for the year 2000. For this color scheme, I used nine classes in order to see the percentages in a more broken up format. The distribution of the Asian population appears to be scattered around continental United Sates, and there is no clear cut distinction between one part of the country and another. Once again, the north arrow provides direction, and the scale bar a basis for measurement.
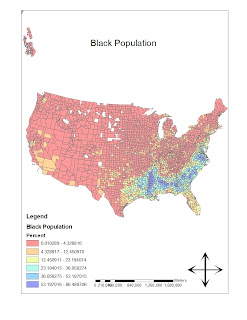
My third, and last map, is titled “Black Population”. The information in this map consists of country level race data, percentage ranked across the United States. I retrieved the data from www.census.gov in the form of an excel document, and it is census 2000 data. In this map, I went back to using six classes for the color scheme. This map, like the first one, emphasizes clearly, where the black population is located in the United States. In, this case, the Black population is concentrated in the southeastern part of the country. The north arrow and the scale bar help in navigation about the map.
The census provided detailed excel documents about each population percentage distribution across the United States. In order to use these data files in Arc Map, it was necessary to modify the contents of the excel documents; I removed the headings above the actual data so that it would be possible to join this data to the counties layer. It was also important to give the excel files a title without spaces so that Arc Map would be able to recognize them.
I have really enjoyed and also hated my experience with GIS. Overall, it is an experience which I have extracted much knowledge from and I am always interested in the different tricks and tools I can use to complete my labs. But, when I am stuck on a step in the process, I become very frustrated and feel like I don't know anything. I enjoy very much however, figuring out the steps which have stopped my progress on my own. It is gratifying to learn from other classmates as well, but when I figure it out on my own, I love it. I feel that GIS gives skills which can be used for a specific field, which is mapping, but it also allows me to work on a huge range of topics (with GIS, I can map pretty much anything). In using GIS, there are no limits to discovering and working in any field. I enjoyed GIS and I would like to continue to intermediate, I hope I can survive.
No comments:
Post a Comment