Introduction
The topic of my research is drug cartels in the country of Mexico and their impacts within the country itself as well as in the United States. Trafficking by drug cartels has been happening for a long time; however drug cartel control of states and consequently death numbers have increased dramatically in the last five years. I focused mostly on the presence of cartels in Mexico because this is the point of origin for the trafficking of drugs (drugs also come to the United States from other countries, but I am choosing to study their transfer from just Mexico). Drugs are produced and trafficked to supply the demands of people who use drugs in the United States. The presence of drug cartels has negatively impacted Mexico and left many casualties; those dead include people actively participating in drug trafficking, government and enforcement officials not cooperating, and innocent standbys. Cartels have spread throughout the country diminishing the authority of government and enforcement officials. Likely scenarios in the lives of Mexican people dealing with the presence of drug cartels are as follows: one day drug cartels fighting for the control of territory start shooting in the middle of a park (30 dead); drug cartels demand monetary cooperation from business owners in a town and if they deny it, family members will end up missing or dead; people seeking help from authorities will receive indifference as a response because authorities themselves are threatened by the cartels or cooperating with them. The maps displayed illustrate distribution of presence of drug cartels in Mexico, distribution of highest death tolls, and presence of drug trafficking organizations in the United States.
Methods
The production and transportation of drugs starts in Mexico and takes several different paths throughout the country until these reach the main portal to enter the United States. Following the path drugs take requires knowing who is in control throughout the country. I gave Mexico’s states a new classification which shows which cartels control which states. However, this is not as simple as it sounds; for the most part, clear distinctions or boundaries for which state territories belong to which cartels are non-existent. Drug cartels are constantly changing their control regions and their allies/enemies with other cartels to their convenience. The presence of these cartels disrupts normal government and enforcement policies and regulations as these officials are threatened by cartels for “cooperation”. Therefore, the drug cartel organizations are becoming a new form of government, and with time, they increase their authority in the states of Mexico. With an unstable government and drug cartel control in Mexico, the consequence is a dramatic rise in casualties. Therefore it is important to study how deaths are distributed in an effort to understand why they are distributed so (I mapped top death tolls by municipality, by state, and showed distribution of deaths across the country). Finally, it is important to study where the drugs are being sent to and how they are getting there. The most common way for drugs to enter the United States from Mexico is by crossing the border; after entering the country, drugs are distributed by drug trafficking organizations in different states (this is also illustrated in one of the maps below).
Results
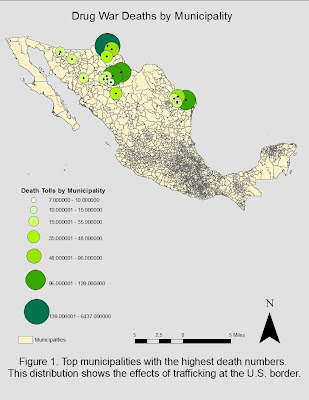
Figure one displays the distribution of deaths by municipality across the northern states of Mexico (Sonora, Chihuahua, Coahuila, Nuevo Leon, and Tamaulipas). These municipalities are the ones in which some of the highest death tolls were taken. Their concentration in the northern region of the country is most likely due to the proximity of these states to the international border. Drug cartel activity should be higher in this region because there is a component of international relations. It is not as easy to traffic drugs across an international border as it is to traffic them within the same country.
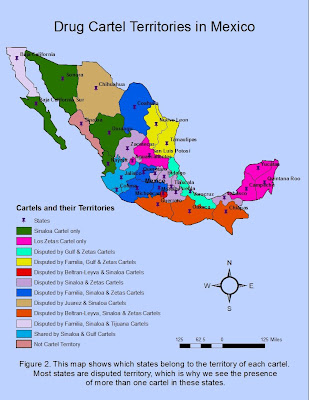
Figure two shows which states are controlled by each cartel. As I mentioned before, there is not a clear distinction of who controls what. As seen in the map, most of the states in Mexico are disputed by the different drug cartels. This means that more than one cartel is present in most states; this kind of cartel distribution results in many violent wars (cartel versus cartel). The different drug cartels are the following: Tijuana, Sinaloa, Los Zetas, Juarez, La Familia, Beltran-Leyva, and Gulf cartels. As shown in the map, some states have been shared by cartels; alliances between them have formed in the past but they are not exactly loyal or constant. The presence of drug cartels in most of the states of Mexico show the growing power of the cartels, this situation only worsens the drug trafficking situation and endangers more lives.
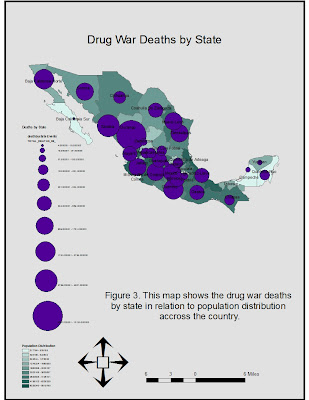
Figure three illustrates death numbers across the entire country by state as well as population distribution. This map is able to show the effect of drug cartels in terms of internal trafficking of drugs, cartel to cartel relations, and the cartels’ form of oppressing citizens (the use of threats and violence). The map shows variability in death numbers, however, it clearly shows deaths happening throughout the entire country. As we can see, it does not necessarily show a correlation between high population and high death numbers.
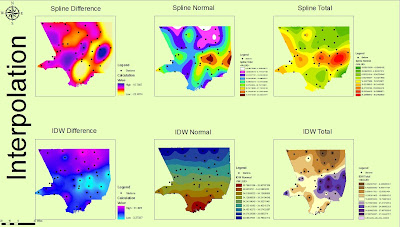
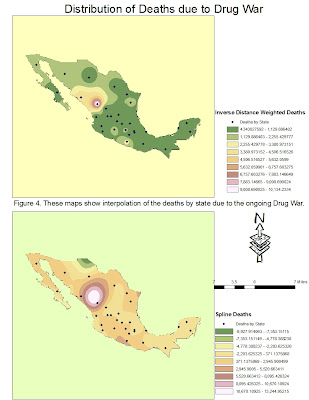
Figure four helps us to understand how death events are distributed in the country through the method of interpolation. The top map of this figure is showing deaths distribution by inverse distance weighted interpolation. This allows analysis of death events in areas where data is not available. This map shows higher death tolls in the northwestern part of the country and lower death tolls towards the center and south regions of the country. The lower map also shows a construction of new data points (distribution of deaths where there is no exact data) from points that were already known (known death events); this one shows the spline interpolation of death events.
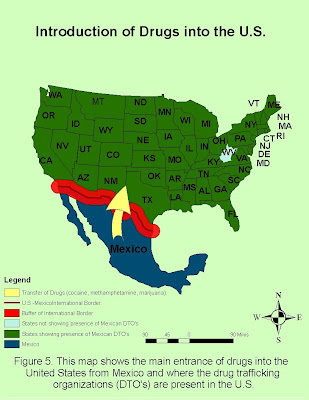
Figure five is useful in emphasizing the international aspect of the drug trafficking problem. It shows the states in the United States which have been known to experience the presence of Mexican drug trafficking organizations. We also see an emphasis in the main route of entrance of drugs to the United States which is the Mexican-U.S. international border. This map illustrates just how much of an impact drug trafficking has on the states, as we see every state except for one with some kind of drug trafficking activity. We can also understand from this map that different types of drugs are transported, among which are cocaine, methamphetamine, and marijuana.
Conclusion
Drug trafficking cartels are turning Mexico into a completely different country. Mexico is experiencing a growing force of the cartels which leads to internal cartel wars, a weak government, and most importantly very high death tolls. Production and trafficking of drugs is still taking place because there are consumers in the United States receiving the drugs. From the analysis, it can also be said that the Mexico-U.S. international border is not as strong as was thought but is instead permeable and allowing drug trafficking to continue. Therefore, I turn to ask, will the United States government do anything to enforce laws and regulations which will prevent the smuggling of drugs into the country? It is difficult to believe that these drug cartels are so organized that they can defeat U.S. efforts to stop drug trafficking which would help alleviate the ongoing drug war. However, we see from the maps displayed that drug trafficking organizations have been present in all but one of the states in the U.S. So meanwhile some kind of plan is made to stop the entrance of drugs into the United States, Mexico will continue to suffer the Drug War; drug cartels will continue to fight for control of Mexican states, killing many in the process, and all of this only to export drugs to the U.S.
References
http://www.ncjrs.gov/pdffiles1/nij/218561.pdf
http://www.justice.gov/dea/major/meta.htm
http://gis.ats.ucla.edu//Mapshare/Default.cfm
http://geo-mexico.com/?s=drug+war&searchsubmit=
http://en.wikipedia.org/wiki/Mexican_Drug_War#Mexican_cartels
http://www.policyalmanac.org/crime/archive/drug_trafficking.shtml
