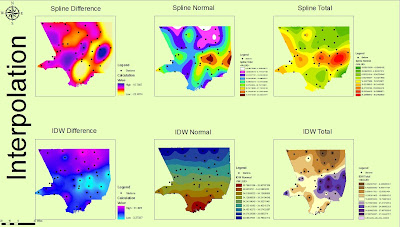
This lab made possible to analyze rainfall for L.A. county with different interpolation techniques. These techniques were useful in generating surface grids from point data. In order to use the point data, I had to make it ArcMap readable by formatting it on excel. I observed that values of total and normal precipitation seem to be variable in terms of which value is higher within each station. Once the data was ready, I had to choose which interpolation technique was appropriate.
At first, it seemed like I just had to chose whichever technique came to mind but as I tried the different techniques (IWD, spline, and kriging), I realized that specific techniques are useful in displaying the L.A. county rainfall data. The one which I found was not useful was kriging, it provided a surface grid which was ineffective in displaying the data. Therefore I used only the spline and IWD techniques. The inverse distance weighted method is useful in creating surface maps for a dense set of points and captures the extent of local surface variation for analysis. The spline method minimizes overall surface curvature; it creates a smooth surface which passes through all the data points.
The different surface grids which result from each interpolation technique can be used for different types of analysis. Therefore, it is important to know what the maps will be used for. Because IWD provides a more point by point specific surface grid, it would be more useful for accurate analysis of stations; for example knowing exactly how many stations there are and where. On the other hand, the spline technique which provides somewhat of a more relative analysis of the stations, can be used to analyze where more stations are needed or where stations need to be shut down. After discussing what each technique might be more useful for, I think the IWD is most useful for the L.A. county rainfall data. I believe so because it allows analysis of each station specifically, because it is appropriate for a dense set of points, and because variation in the surface is displayed.
No comments:
Post a Comment